
Financial Wellness
Are ethnic minorities on track for financial security in retirement?
Most ethnic minority groups expect a higher disposable income in retirement than white British people. And all ethnic minority groups expect to retire, on average, one-to-two years earlier. Yet many ethnic minority groups are less likely to contribute to a private pension.

id
The gap between expected retirement income and what people are likely to actually have looks particularly large for some ethnic groups.
Most ethnic minority groups expect a higher disposable income in retirement than white British people.
And all ethnic minority groups expect to retire, on average, one-to-two years earlier. Yet many ethnic minority groups are less likely to contribute to a private pension.
These findings are from Phoenix Insights’ Longer Lives Index data, which derives from a survey of around 17,000 working age adults, with around 3,100 people from various ethnic minority groups.
This data is still a relatively small sample for individual ethnic minority groups. As such, our aim is to develop the conversation on ethnic differences in retirement prospects and point to areas that are worth exploring further1.
Main findings
After controlling for differences in the age and salary distribution of different ethnic groups, we found that:
1. Most ethnic minority groups expect a higher disposable income (after tax and housing costs) in retirement than the white British group. Despite this, all ethnic minority groups expect to retire, on average, one-to-two years earlier than the white British group. Many ethnic minority groups are also less likely to contribute to a private pension. This suggests that ethnic minority groups may face a greater “expectations gap” – ie, a larger discrepancy between expectations of retirement income and how on-track they are to achieve them – than the white British group.
2. That said, all ethnic minority groups are more likely to expect to draw on secondary property wealth in retirement, by selling a second home or using it as a rental property. Wider support networks in retirement also play a greater role among ethnic minorities. A greater proportion of the Pakistani, Bangladeshi and Indian ethnic groups, in particular, expect to rely financially on their children and, to a lesser extent, on other family and friends. This may go some way to addressing the apparent expectations gap.
3. Most ethnic minority groups are as likely or more likely than white British people to expect to live rent-free in retirement, by either owning their home or living with others. One exception is the black Caribbean group, which is less likely to expect this. However, there are larger differences in the proportion who currently own their home. This suggests that some groups are at greater risk of unexpected retirement housing costs if they cannot get on the property ladder before retirement as expected – particularly those of black African, black Caribbean and other white ethnicity.
These findings suggest that ethnic minority groups expect comparable or better retirement outcomes than the white British group. But it’s unclear whether this will be realised .
Let’s now look at some of these key findings in more detail.
Retirement income
White British, other Asian, and the other white groups all have similar retirement income expectations (after taxes and rent). In contrast, those of other ethnicities expect annual incomes that are around £3,000 to £7,000 higher.
For most ethnic groups, this difference in average expected retirement income is driven by people expecting high retirement incomes.
The Pensions and Lifetime Savings Association publishes a set of Retirement Living Standards, which are designed to help people picture the lifestyle they want when they retire and understand what it might cost2.
The Standards set out what level of income is needed for a ‘Minimum’, ‘Moderate’ or ‘Comfortable’ standard of living in retirement.
For a single person living outside London, the living standards, based on 2021 prices, are around £11,000 for the Minimum, around £21,000 for the Moderate, and around £34,000 for the Comfortable standard3.
Most ethnic groups are very similar in the proportion of people who expect to have less than a Minimum standard (which is 14% across the population as a whole).
However, the proportion expecting a Comfortable standard (27% among the whole population) is noticeably higher among some groups – in particular, among the black African, Indian, Pakistani and Bangladeshi ethnic groups (see Figure 1).
Figure 1: Some ethnic minorities are far more likely to expect a comfortable retirement income standard
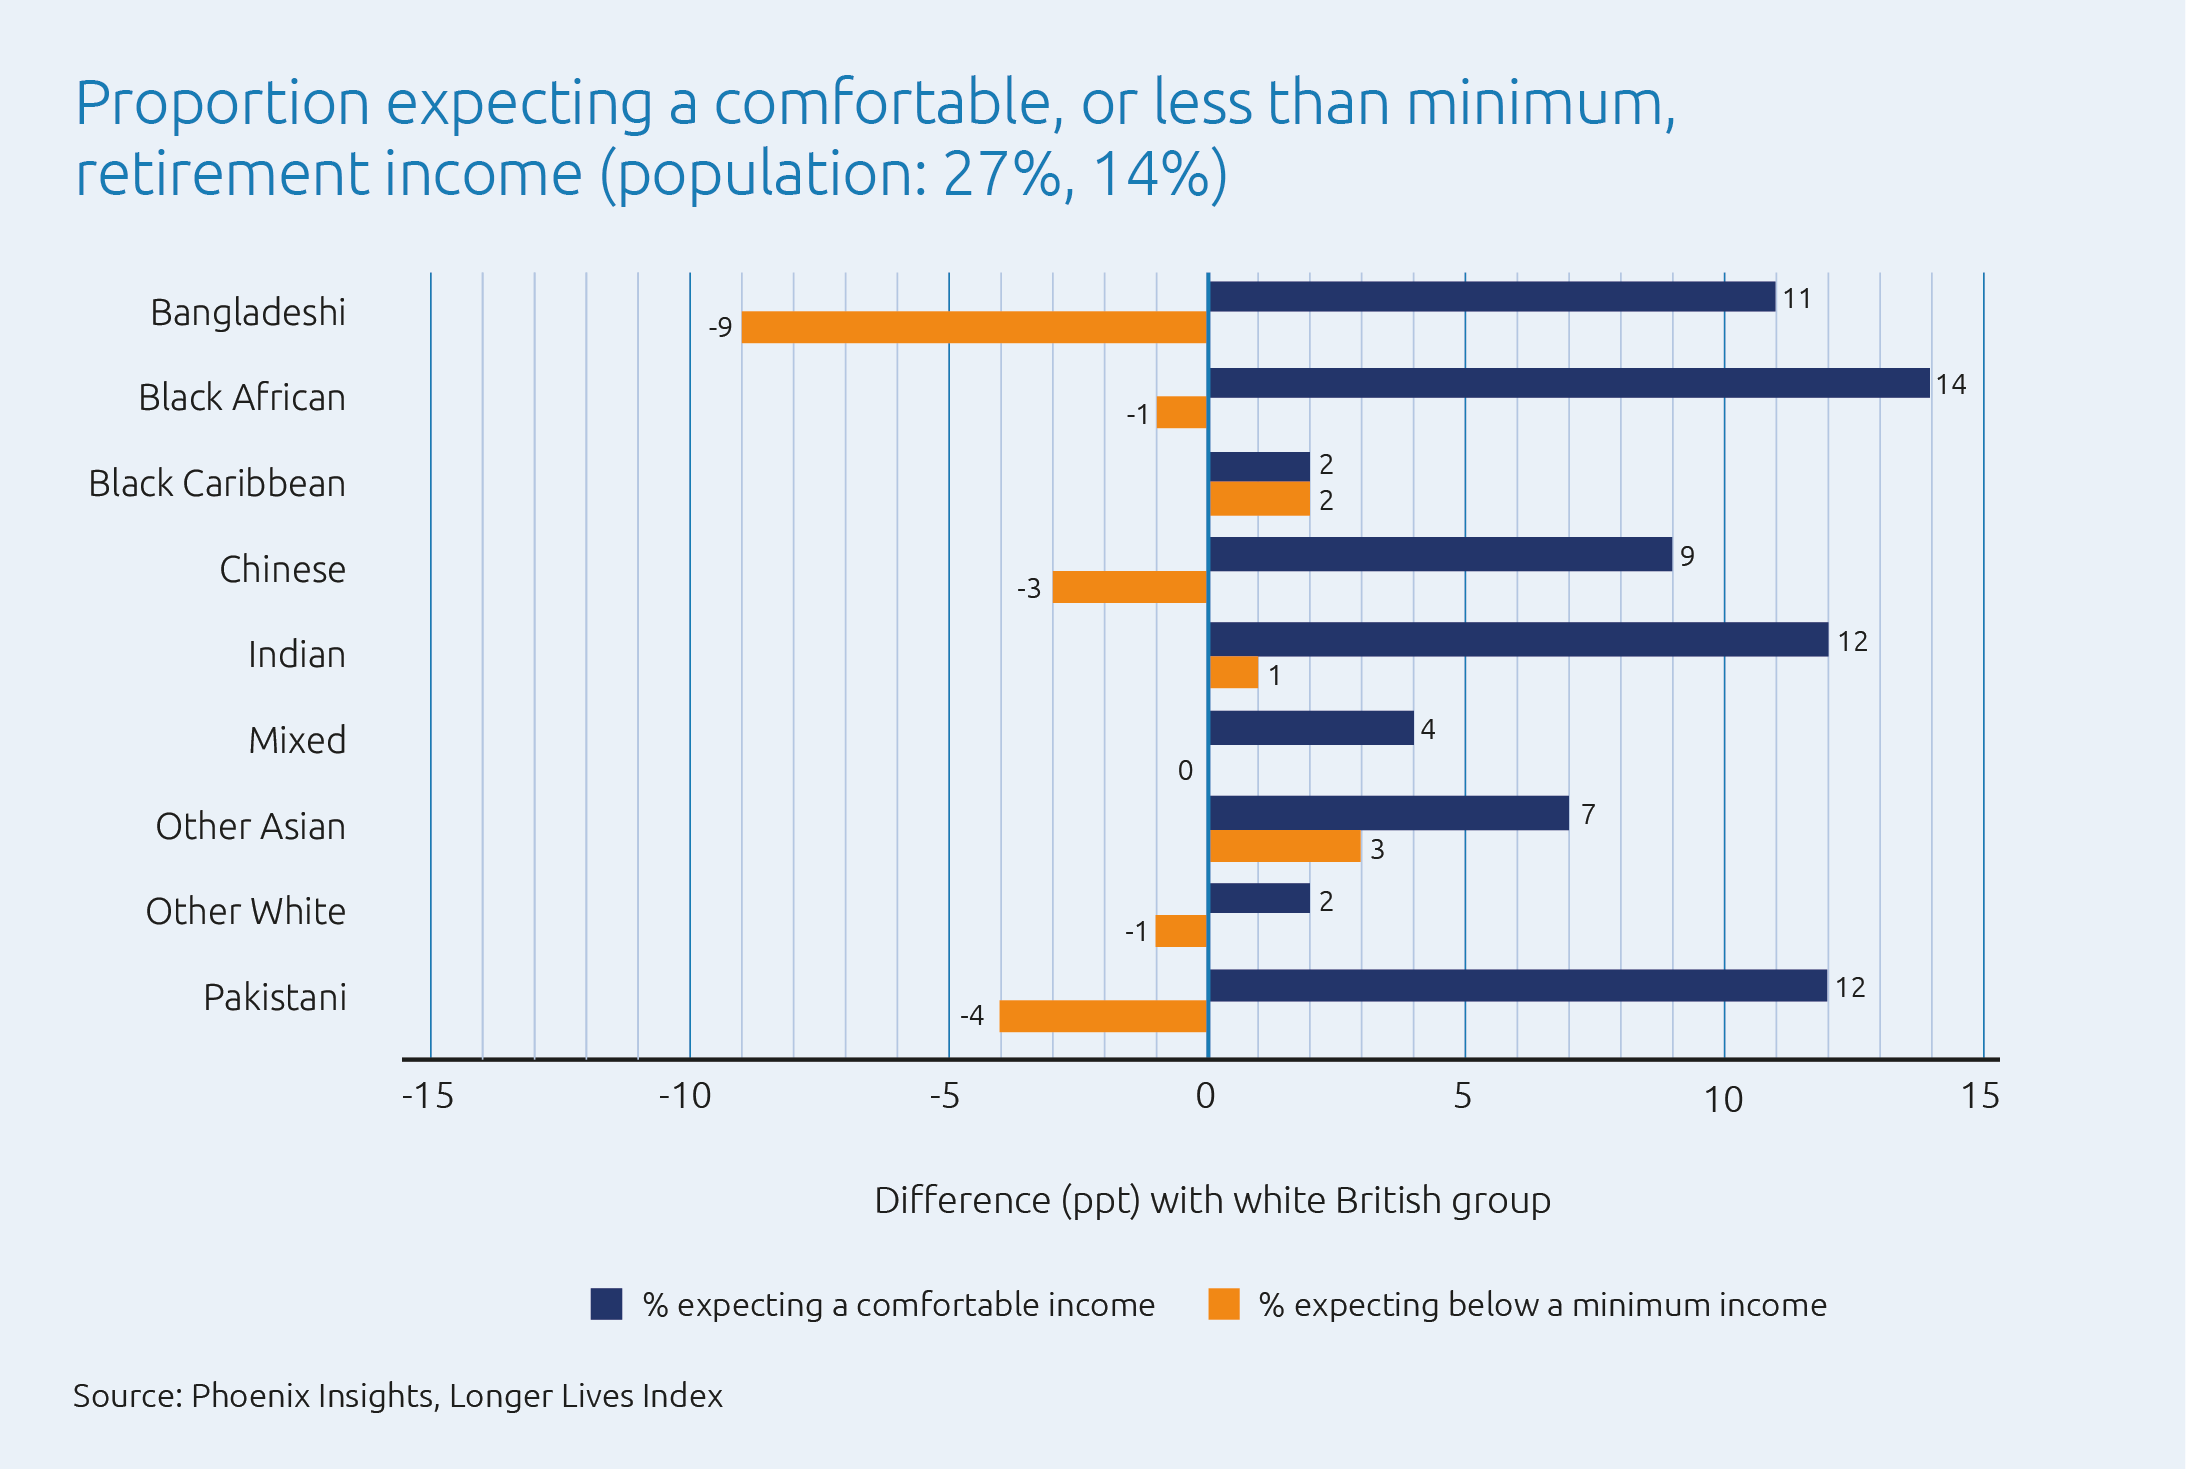
These expectations are in sharp contrast with government figures released in March 2023, which indicate that only 12% of working-age people are projected to have a pension income at or above a PLSA Comfortable standard.
This begs the question whether ethnic minority groups are making greater preparations to support higher retirement incomes than the white British group.
Pension saving
Most ethnic minority groups are no more likely to contribute to a private pension than white British people. The exception is those of Indian ethnicity, who are around 4% more likely to save in a private pension.
The lower likelihood to save into a private pension is particularly striking for those of Pakistani and Bangladeshi ethnicity, who are around 13% and 15%, respectively, less likely to do so.
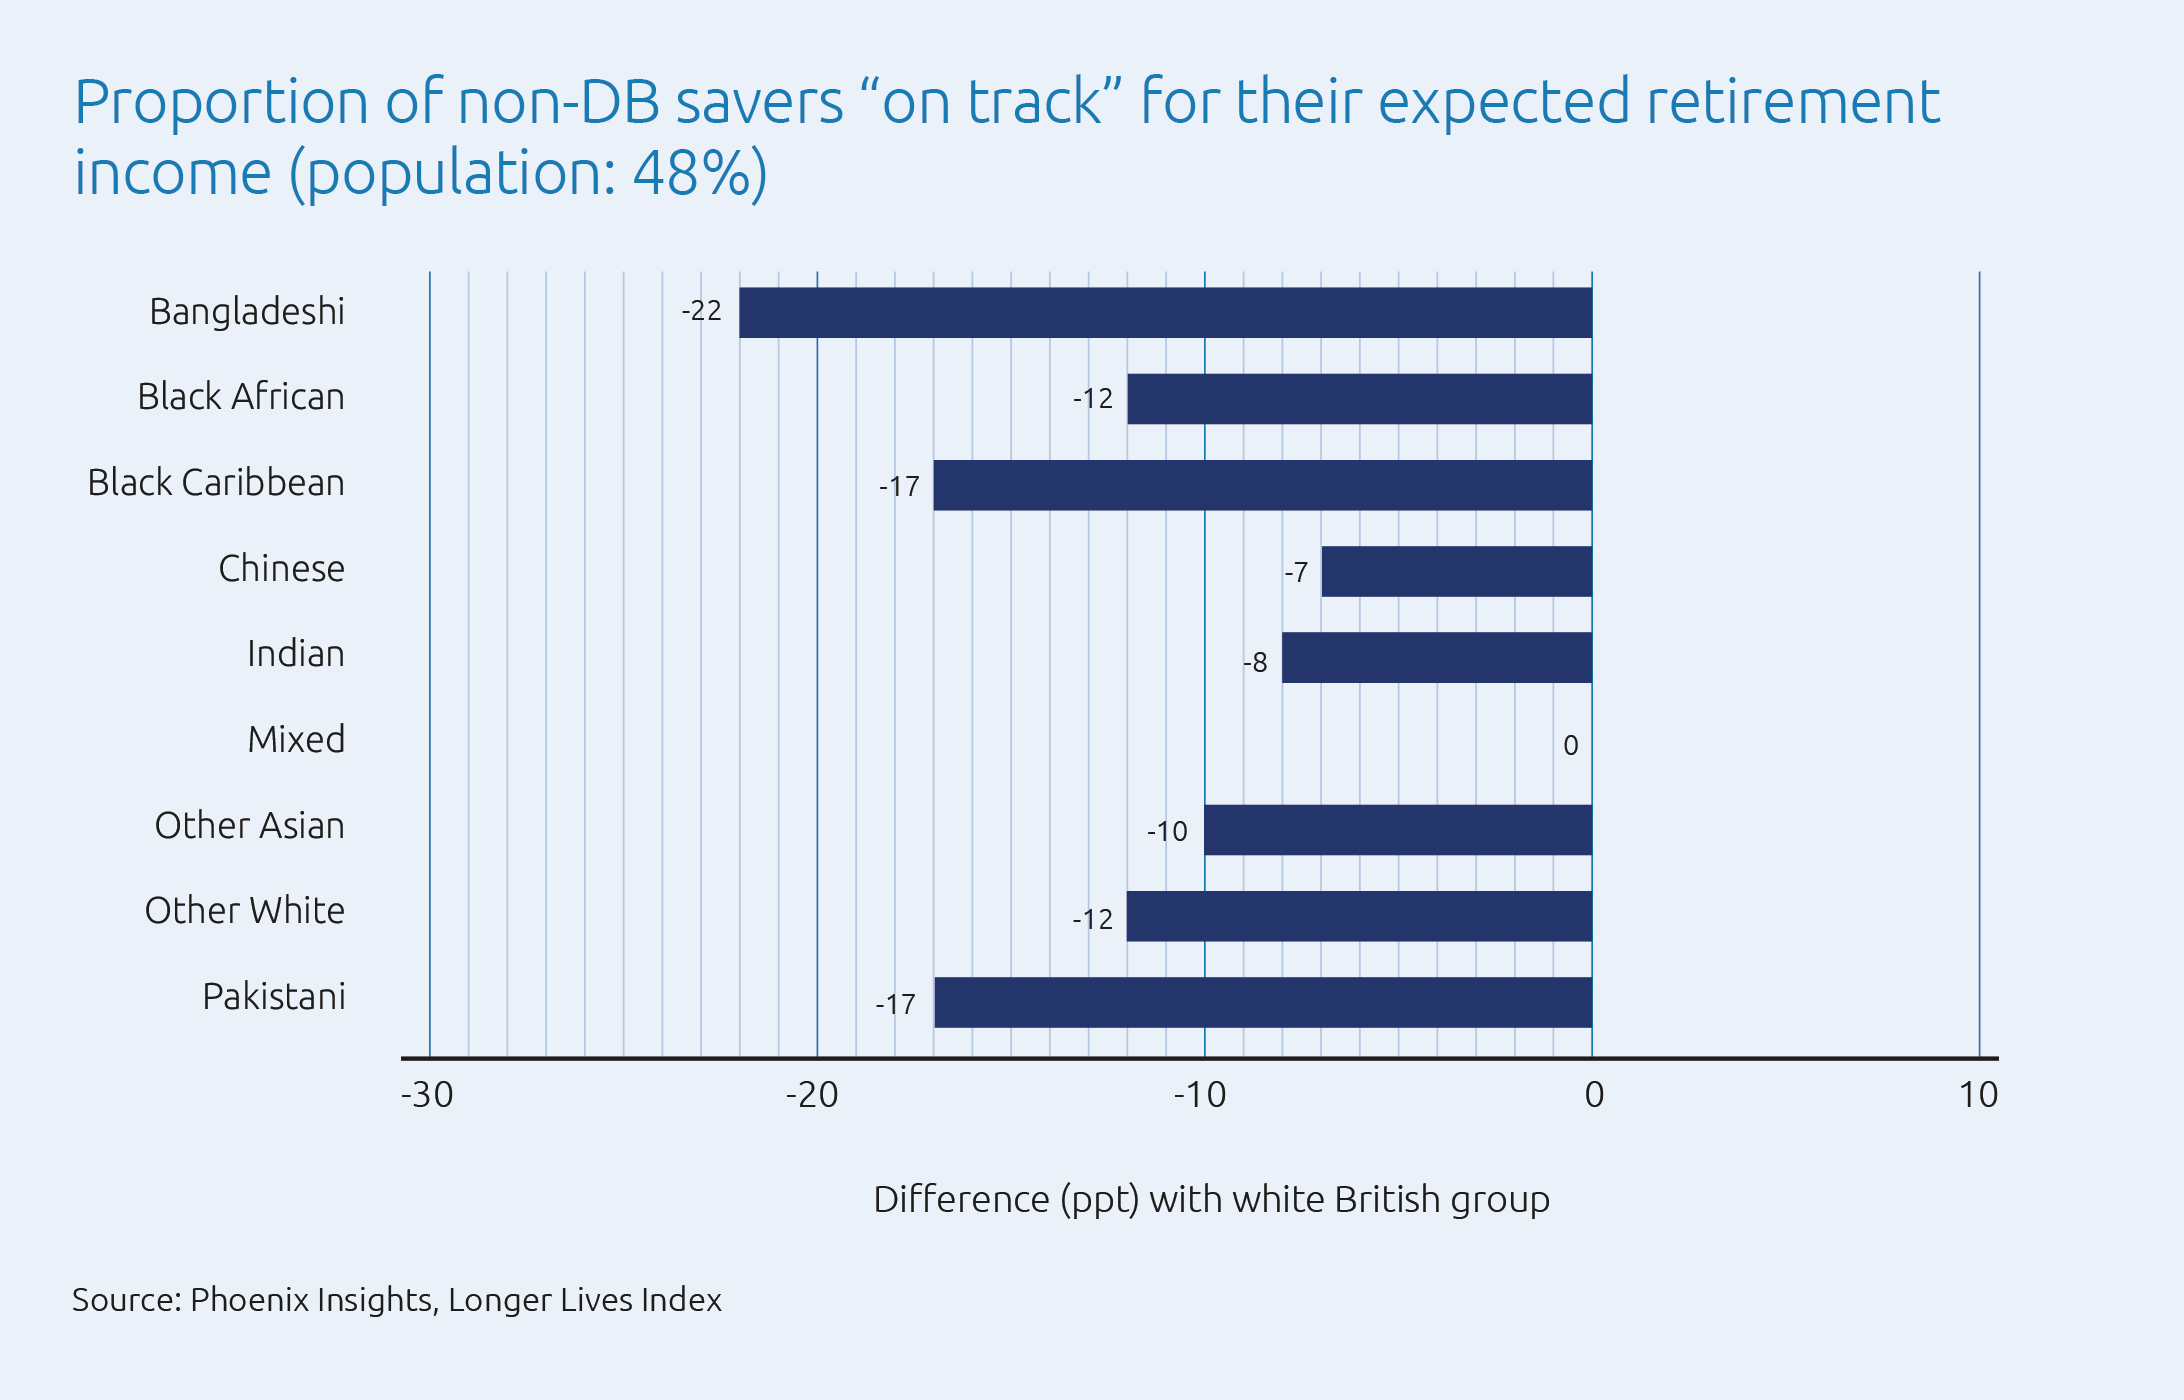
Those of other Asian, other white, mixed ethnicity and Chinese ethnicity are also less likely to be saving in a private pension, to a smaller degree4. This indicates an ‘expectations gap’ – between expectations of retirement incomes and how on track individuals are to achieve them5 (see Figure 2).
In particular, the proportion who are not on track for their expected retirement income is 22% larger among the Bangladeshi ethnic group than among the white British group. And it is 17% larger among the Pakistani and black Caribbean ethnic groups.
Figure 2: Many ethnic minorities are not on track to achieve their expected retirement income
This modelling does not, however, consider other sources of income in retirement or wider support networks. So, let’s now look at those.
Non-pension sources of income
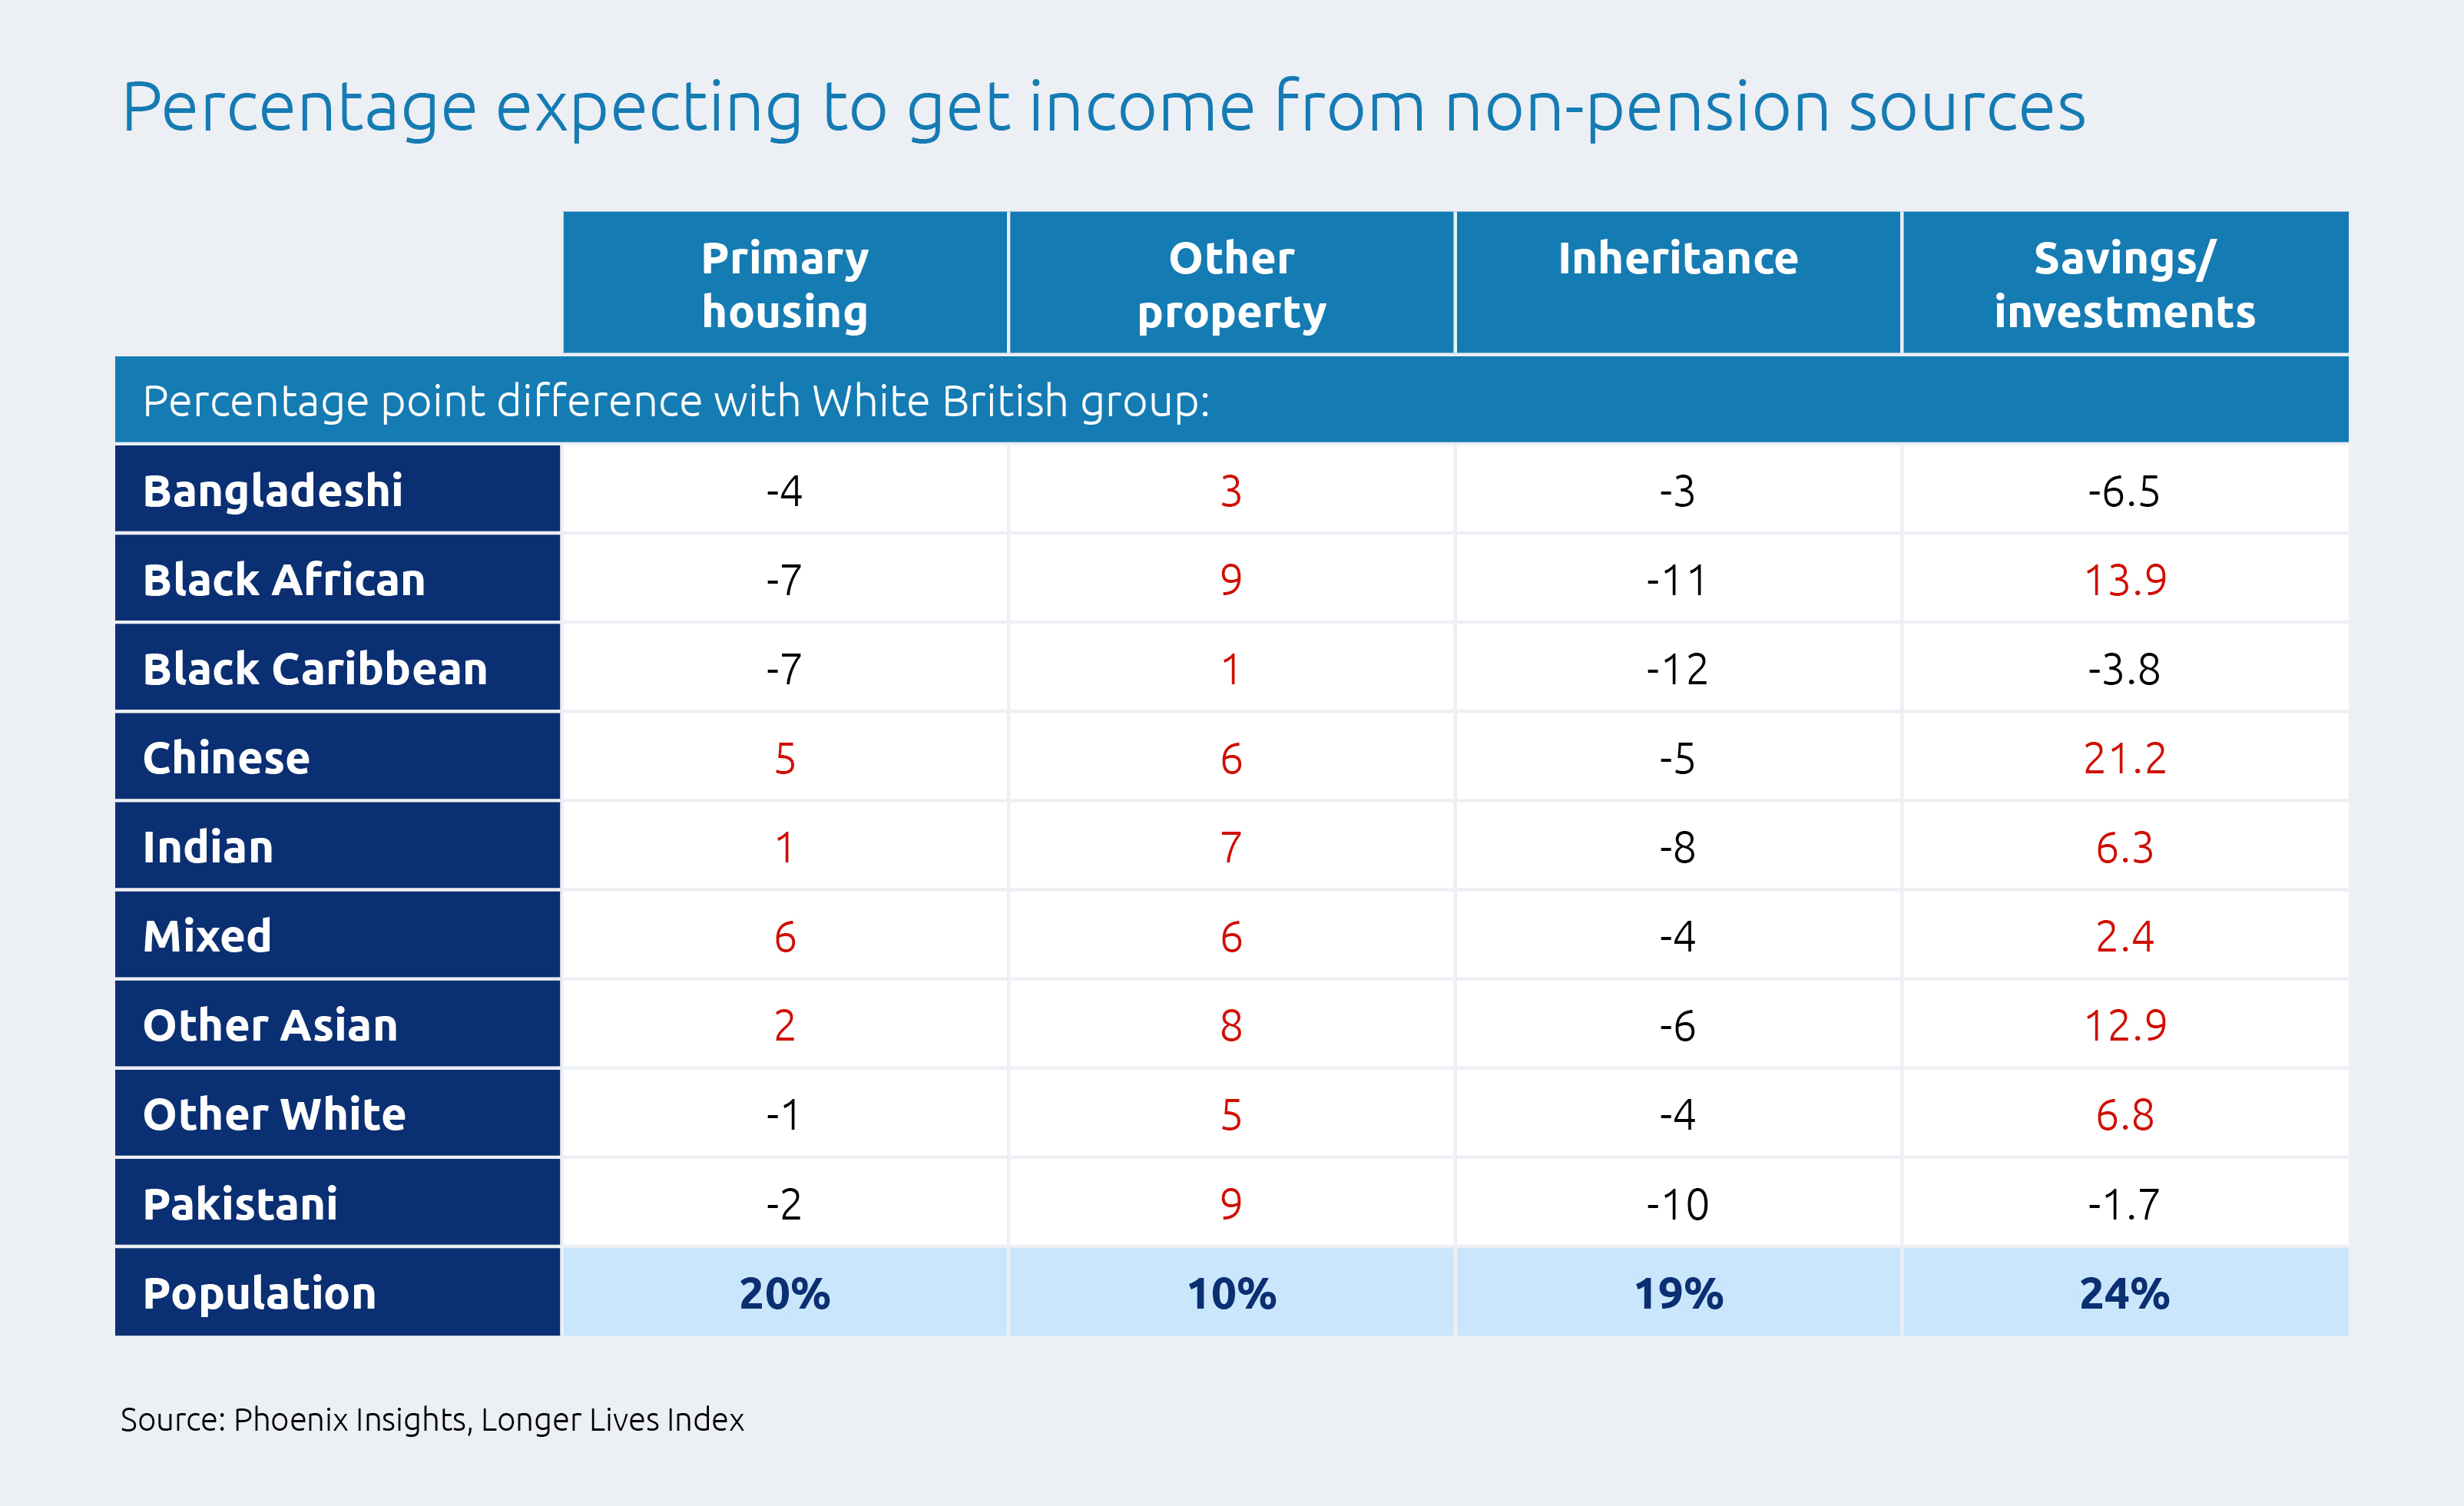
All ethnic minority groups are less likely to expect an inheritance to contribute to their retirement funding.
But most ethnic minority groups are more likely to expect to draw on other property wealth (either by selling a second home or rental property, or using buy-to-let investment income).
Most ethnic minority groups are also more likely to expect to draw on savings or investments than white British people (see Figure 3).
Figure 3: Ethnic groups are more likely than white British people to report that they are buying other property, or preparing for retirement through savings or investments
Support networks
On average, wider support networks are more important for all ethnic minority groups than for white British people.
This likely reflects differences in cultural norms and family structures across ethnicities. In particular, many ethnic minority groups have a greater proportion of multigenerational households than white British people6.
The Pakistani, Bangladeshi and Indian ethnic groups are, for example, much more likely to expect to rely financially on their children than those of white ethnicity (by 29%, 22% and 17%, respectively). They are also more likely to expect to rely on other family and friends, though this is less commonly expected than relying on children.
These ethnic groups are also more likely to expect to support children and other family and friends. This suggests there are greater informal financial flows for these ethnic groups in general, rather than a single direction of intergenerational redistribution that may be more common within families of other ethnic backgrounds.
Conclusion
After controlling for age and income differences, virtually all ethnic minority groups expect higher retirement incomes than white British people.
Yet they also expect to retire around one-to-two years earlier, on average, and are often less likely to be saving in a private pension and to own their home.
Clearly, other resources – specifically, secondary housing assets – are expected to play a role for many. And wider support networks appear to be more important among ethnic minority groups than the white British group.
However, further analysis is needed to see whether these factors are enough to mean that ethnic minority groups are on track for the retirement income they expect.
Next steps
To read more about how retirement planning may vary by ethnicity and other factors, please see:
How attitudes towards saving and retirement vary by age, gender and ethnicity
How to boost diversity, equity and inclusion in pensions systems
OECD report: Diversity, equity and inclusion in asset-backed pensions
Retirement preparations among different ethnic groups
1In particular, the available sample size of the Bangladeshi group suggests that further corroboration of the results for this ethnic minority would be particularly valuable.
2Further exploration of these expectations would be valuable to corroborate this picture. In particular, the motivations for current saving behaviour and the expectations of future wealth accumulation of each ethnic group require further analysis, as do the levels of wider support expected in retirement and the drivers of this support.
3The PLSA Standards were updated in January 2023. However, this analysis compares pension income against the 2021 Standards.
4This broadly accords with data from the ONS on differences between ethnic groups in the proportion who have any private pension wealth, available here: Household wealth by ethnicity, Great Britain: April 2016 to March 2018. The ONS analysis does not control for the age or salary structure of each group, relates to the whole population (rather than just working age adults), and compares whether any private pension wealth has been accumulated (rather than current contribution behaviour).
5For those who are not currently contributing to a defined benefit (DB) pension, we have drawn on previous modelling work to examine explicitly whether or not they look on track to achieve their expected retirement income. This modelling considers people’s existing wealth stocks, their likely future pension and non-pension saving (based on their current saving behaviour), and their planned retirement age, and assumes that everyone is entitled to a full state pension. The results illustrate an expectations gap that is worse (for those without a DB pension) among most ethnic minority groups than among the white British group.
Related Articles
-

Inheritance tax changes and pension scams: what employers should know
Learn how employers can support employees during this time. Donna Walsh
July 06, 2026
Read more4 mins read -

Rethinking financial wellbeing: from pensions to personal finance
Financial wellbeing is a growing priority for employers. But creating meaningful impact means going beyond pensions and offering practical, relevant support that reflects employees’ day-to-day financial lives. Emma Furlonger
June 01, 2026
Read more5 mins read -

Practical ways to support women’s financial wellbeing at every age
The cost of living and key life events are having a disproportionate impact on women’s finances. Here’s what employers can do to help boost women’s financial wellbeing – whatever life moments they’re facing. Gail Izat
March 31, 2026
Read more5 mins read